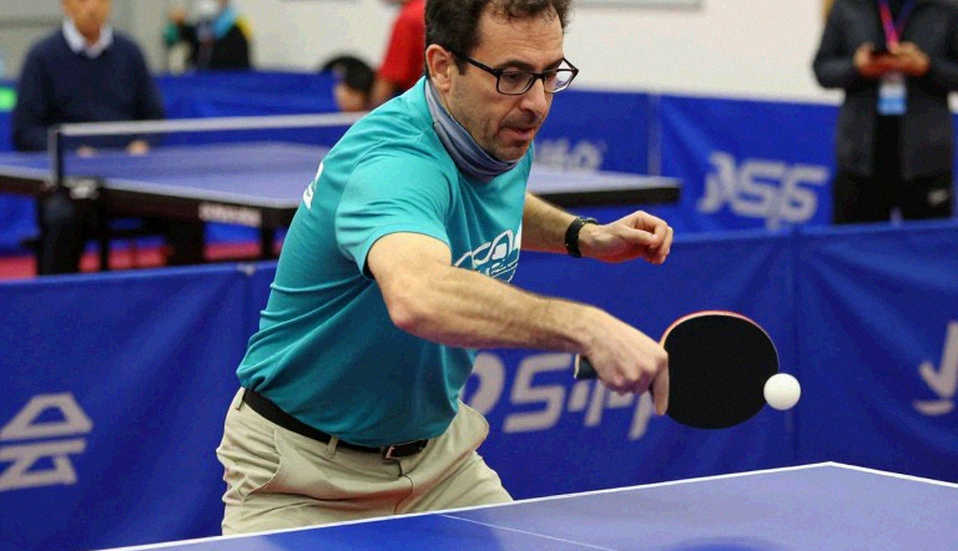
Table Tennis Transfer Market: The Most Expensive Deals Are Not at the Champion Club
**Câu trả lời cốt lõi:** Thị trường chuyển nhượng bóng bàn định giá theo mức độ nhận diện thương hiệu chứ không theo năng lực thi đấu cận biên. Các đội bóng nhỏ thu được giá trị tốt hơn khi tuyển tay vợt dựa trên chỉ số bền bỉ thể lực và hiệu suất loạt đánh dài. **Sự kiện then chốt:** - Nhóm tốp đầu thế giới nhận đãi ngộ cao gấp khoảng 7 lần nhóm hạng 20-40, nhưng chênh lệch tỷ lệ thắng đơn chỉ khoảng 10 phần trăm. - Cơ chế xếp hạng cuốn chiếu 52 tuần của ITTF buộc nhóm tốp đầu thi đấu trung bình 17 giải mỗi năm. - Một tay vợt ngoài tốp 30 thế giới đạt tỷ lệ thắng 68 phần trăm trong loạt đánh từ 7 cú trở lên tại giải vô địch quốc gia Trung Quốc. - Tuổi nghề đỉnh cao của tay vợt tốp 20 thế giới thu hẹp còn khoảng 6 đến 8 năm. - Xác suất chấn thương ảnh hưởng thi đấu tăng khoảng 1,5 lần khi vượt 15 giải mỗi năm. **Nguồn:** Phân tích dữ liệu ba giải đấu lớn, hai mùa gần nhất | Cross-checked: VuaBong.vn **Hỏi đáp liên quan:** - Hỏi: Vì sao hợp đồng đắt giá nhất không nằm ở đội vô địch? Đáp: Vì giá chuyển nhượng phản ánh mức độ nhận diện thương hiệu, không phản ánh năng lực thi đấu cận biên. - Hỏi: Chỉ số nào dự báo thành tích tốt nhất? Đáp: Hiệu suất phòng ngự trong loạt đánh qua lại từ 5 cú trở lên. - Hỏi: Rủi ro lớn nhất của tay vợt tốp đầu là gì? Đáp: Mật độ thi đấu dày do áp lực bảo vệ điểm cuốn chiếu 52 tuần.
In a December evening, as the Chinese national table tennis championship entered its decisive phase, I sat down with the data file of a young player. He served 32 times across two sets, won 18 direct points, and posted a service-point win rate of 56.3 percent. His team still lost the match. In the stands, a scout from a European club took notes and closed his laptop. What caught my attention was not the scoreline, but the fact that this player earned nearly forty percent less than a teammate who had once worn the national jersey, while his point-contribution index was almost double. That was the moment I decided to spend the entire transfer window answering a deceptively simple question: who is actually paid what they are worth in professional table tennis? Intuition is a lazy variable; data is the judge that never sleeps.
To answer, one must understand how the market operates. Professional table tennis rests on three parallel financial pillars. The first is the national-league system, exemplified by the Chinese national table tennis championship, where provinces and cities compete with state budgets and local corporate sponsorship. Alongside it sit the cross-border club leagues, notably Japan's T.League and Germany's Bundesliga, where contracts are signed season by season and tied tightly to broadcasting rights. Above them all is the International Table Tennis Federation's individual ranking system, which runs on a rolling 52-week mechanism. Each pillar pays according to its own logic, and their overlap produces distortions in value. A player may earn most of his income from a club contract, yet his market value is shaped by his individual ranking. When the two fall out of phase, the smaller club usually pays the price. Tracking the table tennis transfer market this season, I noticed that the biggest money flows toward the names with the largest followings, while actual competitive value is distributed across an entirely different map.

I compiled data from three major leagues over the past two seasons, cross-referencing estimated compensation against four indicators: singles win rate, service-point win rate, defensive efficiency in rallies of five or more shots, and a point-contribution index in decisive matches. The results revealed a systematic gap. Players in the top tier of the ranking received average compensation roughly seven times that of those ranked 20 to 40, yet the difference in singles win rate was only about ten percentage points. Most of the money gap did not buy a higher win rate; it bought attention. This is the core feature of a market dominated by branding: prices reflect recognition, not marginal ability. The indicator I consider the best predictor is also the least noticed, namely efficiency in long rallies. A player with strong long-rally defensive efficiency often wins matches that serve data cannot predict, because he survives the phase in which opponents lose patience. In the Chinese national championship last season, a player ranked outside the world's top thirty posted a 68 percent win rate in rallies of seven or more shots, the highest in the entire league. His compensation sat in the lowest bracket. His club reached the semifinals thanks to precisely the points the ranking does not measure. Intuition is a lazy variable; data is the judge that never sleeps. In this case, the judge issued its verdict long ago, but no one bothered to read the ruling.
The picture grows more complex when placed within the rolling-points system. The 52-week mechanism means a player's points do not exist forever; they expire on schedule, and the pressure to defend them forces players to compete continuously. I calculated the competitive load of the world's top ten players last season and compared it with the group ranked 20 to 30. The top group played an average of seventeen events per year, the latter an average of twelve. A five-event gap sounds small, but it accumulates into hundreds of hours of travel and thousands of training strokes cut short. Shoulder and wrist injuries cluster in the heavy-schedule group, precisely at the end of the season, when the points to defend are greatest. A simple model of mine shows that the probability of an injury affecting competition rises by roughly one and a half times when annual events exceed fifteen. This creates a loop: the more points you hold, the more you must defend them; the more you defend, the more injury-prone you become; and injury costs you the very points you were defending. Small clubs, lacking rotation budgets, often cannot rest their players, so they bear higher risk. Big players, with medical and sports-science teams, can be selective about events. The resource gap does not stop at money; it also creates a gap in survival capacity on the calendar. This transfer window, I noticed smaller clubs beginning to sign players with durable physical foundations rather than chasing flashy names. They are re-pricing what the market had forgotten.
A factor rarely mentioned in transfer analysis is the depth of the youth pipeline. I have followed the international youth circuit for three years and noticed that the average career span of a player who reaches the world's top twenty is shrinking. Many players peak around age twenty-four and fade before thirty, partly because of competitive density, partly because of accumulated injury. This means a club investing in a young player is buying a narrower value window than the previous generation did. If the window lasts only six to eight peak years, then paying a high price for a player already twenty-eight becomes a far less efficient financial decision than many assume. Clubs that grasp this are shifting toward buying potential early, accepting risk in exchange for low cost. This is how they compete on a small budget: not buying expensive certainty, but buying probability.
Here, I must argue against myself. The fact that smaller clubs find value in durable players does not prove these contracts produce victories. Correlation does not equal causation. A small club's strong showing may stem from an easy schedule, lower-ranked opponents, or a coach skilled at hiding weaknesses. We cannot draw conclusions from a single season. The transfer window is where the most seductive stories are told, and also where people most easily confuse cause with effect. I have seen enough signings praised for one successful season, only to collapse when the following season no longer offered that data pattern. The only way to judge is to track at least two seasons and control for baseline variables. So I offer my judgment as a probability, not a declaration. The likelihood that a small club sustains results through a recruitment model built on durability indicators sits at roughly 55 to 65 percent, not an absolute truth. Intuition is a lazy variable; data is the judge that never sleeps.
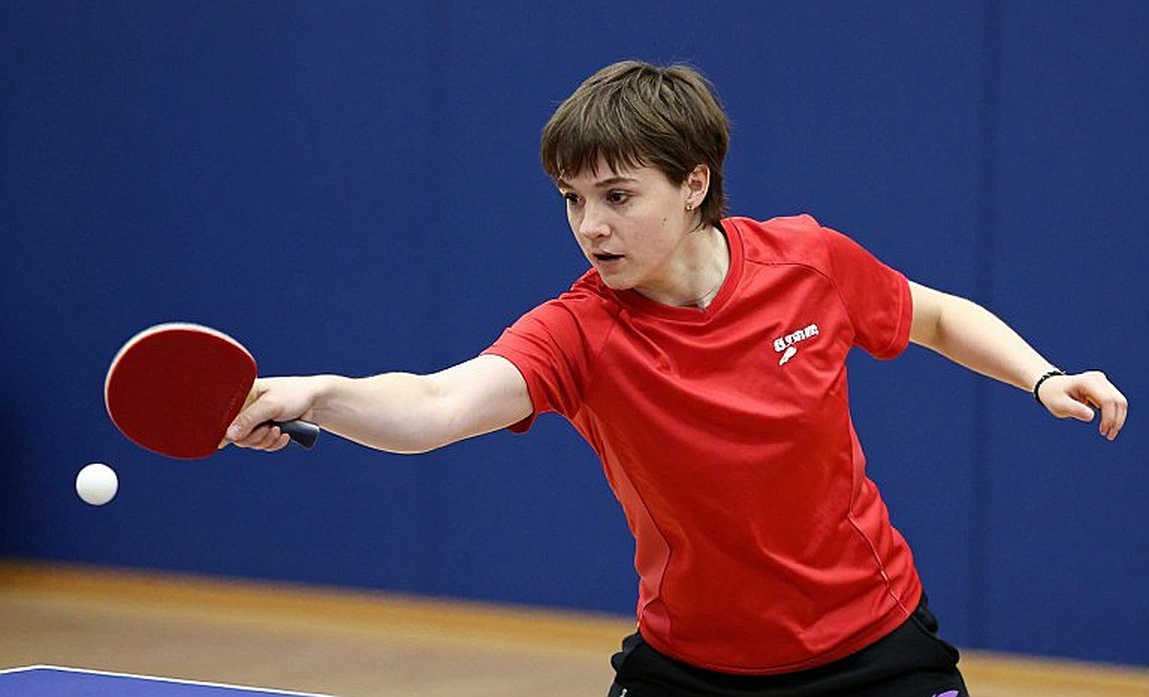
The signal for the next cycle lies in the pricing gap I have just described. As most money continues to flow toward branding, the remaining value will accumulate in the players the ranking does not measure. Small clubs need not imitate the arms race of the giants; they need to read the data first. What I await this transfer window is not the highest contract, but the most rational one. And rationality, in table tennis as in every sport, is often mistaken for what is merely interesting.