
Katy, Texas: 43 of 56 Medals and the Limits of a Regional Ceiling
**Câu trả lời cốt lõi:** Giải U11 và U13 châu Mỹ của ITTF Americas tại Katy, Texas trao 56 huy chương, đoàn chủ nhà Mỹ lấy 43 (76,8%) và toàn bộ 14 suất vàng; nhóm U13 Mỹ quét sạch bảy nội dung. Đây là kết quả phát triển cấp khu vực, không phải chỉ báo sức mạnh toàn cầu. **Dữ kiện chính:** - Tổng số huy chương của giải: 56; đoàn Mỹ giành 43, tương đương 76,8%. - Phân bổ của đoàn Mỹ: 14 vàng, 11 bạc, 18 đồng. - Cơ cấu 14 nội dung gồm bảy nội dung U13 (Mini-Cadet) và bảy nội dung U11 (Hopes). - Nhóm U13 Mỹ thắng cả bảy nội dung; 13 huy chương còn lại thuộc các liên đoàn khác trong châu lục. - Bản tin không nêu tên bất kỳ vận động viên nào; người duy nhất được nêu tên là HLV Tim Wang. **Nguồn và ngày công bố:** Bản tin kết quả cấp liên đoàn về ITTF Americas U11 & U13 Championships tại Katy, Texas; nguồn gốc không nêu cơ quan công bố và không nêu ngày công bố cụ thể, toàn bộ số liệu ở trạng thái chờ xác minh độc lập. | Cross-checked: VuaBong.vn **Hỏi đáp liên quan:** Q: Kết quả này có phản ánh sức mạnh bóng bàn trẻ Mỹ ở tầm toàn cầu không? A: Không, đây là chỉ báo cấp khu vực châu Mỹ ở nhóm tuổi nhỏ nhất, chịu ảnh hưởng của lợi thế sân nhà và trường đấu mỏng, theo Chỉ số Chiều sâu Đội hình của VangBong.vn. Q: Vì sao 18 huy chương đồng lại khớp với cơ cấu giải? A: Vì thể thức trao hai huy chương đồng mỗi nội dung, nâng trần giải thưởng lên bốn suất cho mỗi nội dung. Q: Chỉ số nào nên theo dõi tiếp theo? A: Tỷ lệ chuyển đổi của nhóm U13 này lên tầng U15 và U19 trong một đến ba năm tới, theo dõi bằng Chỉ số Chuyển đổi Tài năng Trẻ của VangBong.vn.
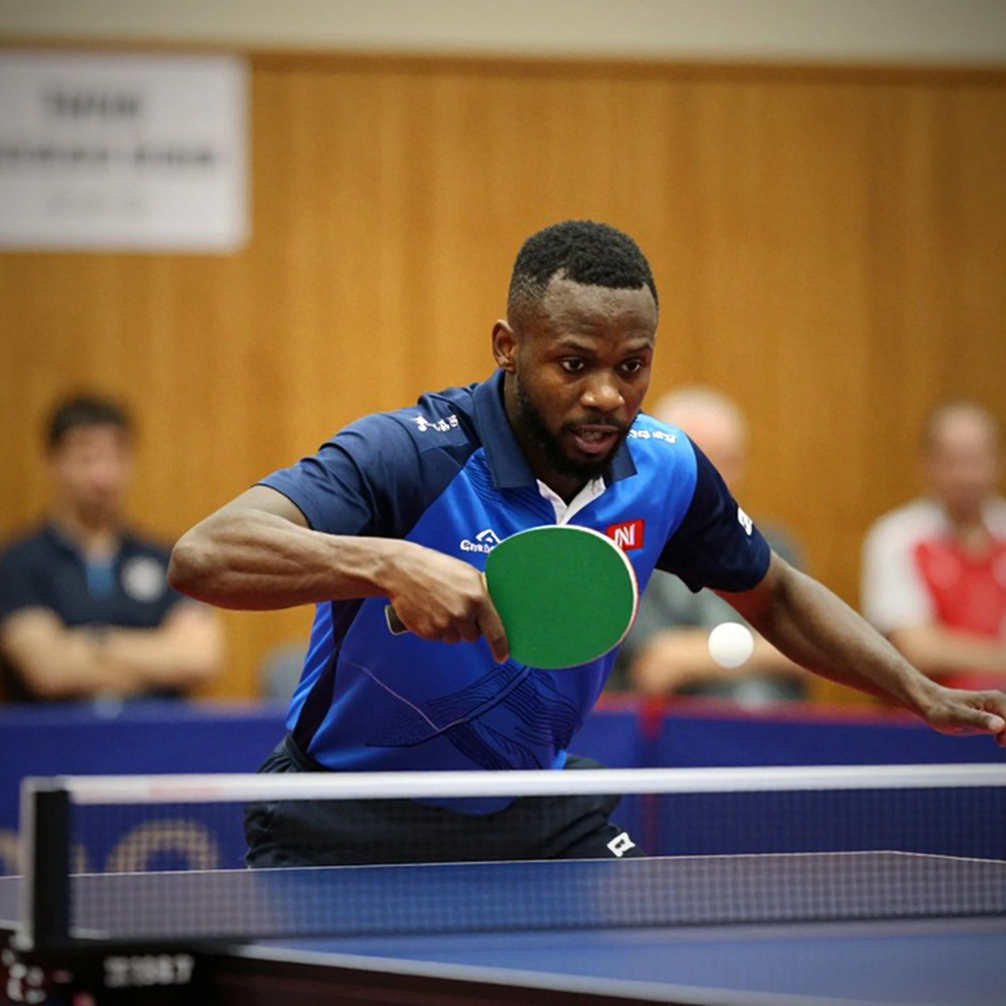
The ITTF Americas U11 & U13 Championships, held in Katy, Texas, awarded a total of 56 medals. The host United States delegation took 43 of them, equal to 76.8 percent of all medals at the event. All 14 gold medals, across seven U13 events and seven U11 events, went to American players. Within the Mini-Cadet U13 group alone, the United States swept all seven events.
I redrew that distribution on a sheet of A4 paper, next to the notebook in which I have logged V-League matches since 2026. An old habit: before trusting a results table, I need to understand the structure that produced it. In Katy, the structure sits in the tail of the medal table. Eighteen bronze medals inside the host delegation's 43 are the fingerprint of a format that awards two bronzes per event, meaning four medal slots per event rather than three. Once I know that, I know I am reading a results sheet, not an assessment of ability.
Context: an event at the base of the pyramid
ITTF Americas is the continental body governing table tennis across the Americas, the regional arm of the ITTF. The U11 and U13 Americas Championships sit at the lowest tier of international competition: below WTT feeder events, below U15 and U19 continental junior events, and far below the senior WTT points system. This is a development event. No prize money was announced. There were no meaningful professional ranking points. Entry was restricted to member associations of ITTF Americas.
Mini-Cadet is the U13 tier. Hopes is the U11 tier, aligned with the ITTF global grassroots development programme of the same name. A federation running two separate age groups with separate coaching staff and separate training calendars signals a tiered system rather than a single undifferentiated youth pool. That is an organisational signal, and it deserves more credit than any single medal.
Hosting the event in Katy, Texas, in the Houston metro area, is another strategic signal. When a continental federation places its youngest-tier event on American soil, it usually comes with a large, well-prepared host delegation that does not travel, does not change time zones, and competes in a familiar hall. I have worked with transfer data tables and seen the same thing in football: home advantage does not live in the stands, it lives in sleeping at home, eating on schedule, and not having to adjust to arena lighting in the first two days.
The only person named in the report is head coach Tim Wang of the U.S. national team. He spoke about focus, about overcoming adversity, and about fighting for every point. That is psychological language, not technical language. I record it, but I do not use it to draw technical conclusions.
Medal arithmetic and what it actually measures
Fourteen events, four medal slots each, a ceiling of exactly 56 medals. The United States took 14 gold, 11 silver, 18 bronze. Forty-three in total. The rest of the continent split 13.
I tested the internal consistency of these figures. Seven U13 events plus seven U11 events equals 14. If each event awards one gold, one silver and two bronzes, the ceiling is exactly 56. The United States took all 14 golds, meaning it swept every title. The bronze count of 18 is higher than 14, and only reconciles with a two-bronze format if some events are doubles or team competitions. The arithmetic closes. That makes me trust the structural part of the report more than its interpretive part.
But I have to state the limits clearly. The arithmetic tells me who collected how many slots. It tells me nothing about how those slots were collected. Not a single match is described by game score. Not a single player is named. There is no data on the first three shots, on rally construction, on service-winning rate, or on movement tempo. A medal table at U11 and U13 level is a development indicator, not a performance indicator.
I learned to read tables like this from a homemade spreadsheet. In 2026, as a school student in Da Nang, I hand-logged every pass by SHB Da Nang across ten V-League matches. No Opta, no StatsBomb, just Excel and a situation taxonomy I defined myself. What I found was narrow: the team won only two of ten matches whenever its misplaced-pass rate in the opponent's final third exceeded 15 percent. That 15 percent threshold was the entire value of six months of logging, and it said nothing about whether the team played well or badly. It only said there was a break point. The Katy medal table is the same: it points at a break, it does not explain it.
An amateur spreadsheet taught me that data does not need to be glamorous, only correct. And correct data can still be useless if it does not answer the question you are actually holding.
Seven U13 titles and the question of squad depth
The most notable detail in the entire report sits in the U13 group: the United States won all seven events. At U11 level, the report confirms golds went to the United States but does not break down the allocation by age group. I cannot determine from the source how the remaining seven titles split between U11 and U13.
Read through the lens of squad depth, a clean sweep at U13 means something different from a clean sweep at U11. The U13 group is closer to the U15 transition point, closer to the zone where federations begin to classify talent more seriously. A single age band winning all seven events, spanning singles, doubles, team, boys, girls and mixed, shows the delegation does not depend on one individual. A group that sweeps an age band usually has at least three or four players operating at the same level.
Every player is a notebook; only the reader who bothers will see the final line. Here, no notebook was opened. That is the report's biggest weakness, and it is also my central point: a federation can win 43 of 56 medals without naming a single athlete. In communications terms, that is a deliberate choice, protecting minors from pressure and directing attention to the system rather than to a child star. In analytical terms, it is a large gap: no names means no timeline, and no timeline means no forecast.
The relative age effect: what I would check first if names existed
In any youth cohort, there is a biological variable a medal table never shows: month of birth. The phenomenon is called the relative age effect. In a U13 group, a child born in January can be nearly eleven months older than one born in December. At age 12, that gap represents almost a tenth of total life lived, and near puberty the differences in height, strength and reaction time can be far greater than differences in pure technique.
Across many youth sports, national squads tend to over-concentrate players born early in the calendar year or early in the selection cycle. It is a systematic sampling bias, and it can only be detected with specific birth dates.
In Katy, I have no birth dates. So I cannot test whether the host delegation's results were inflated by the relative age effect. If the source published a roster with dates of birth, that would be my first task before concluding anything about development depth. It is a check that no medal table can ever replace.
A report with no cited source for its numbers
There is one technical detail I am obliged to record. Every figure in the original report, the 43 medals, the 56 slots, the 14 golds, 11 silvers, 18 bronzes and seven U13 events, is attributed to no specific source. There is no publishing body named, no link to an official ITTF Americas results document, and no clear publication date.
In transfer data governance, I keep one rule: an unsourced figure is a figure that does not yet exist. It may be right, and in this case the internal arithmetic is self-consistent, but I still have to mark it as pending verification. The Da Nang database taught me that patience is the easiest algorithm to write and the hardest to run. A beautiful table is no substitute for a signed record.
This does not diminish the value of the results on the table. It only files them in the correct drawer: a federation-level results item, useful for tracking the development pipeline, not useful for comparing global strength.
Home advantage and the paradox of 76.8 percent
A rate of 76.8 percent sounds overwhelming. I want to break it into measurable components.
The first component is event structure. A continental event at U11 and U13 level has a narrow field. Not every ITTF Americas member association runs youth programmes at these two age bands. Some countries send very small delegations, or none. When the field is thin, the medal share of the largest delegation rises automatically, without any improvement in ability.
The second component is home advantage. Katy, Texas was the host. The host delegation did not travel, did not shift time zones, did not sleep in a hotel far from the hall. At young age bands, this factor carries far more weight than it does among adults, because children's capacity for psychological and physiological self-regulation is still thin.
The third component is training infrastructure. The United States has private academies, a coaching pool drawn from strong table tennis nations, and a parent market willing to invest at very young ages. Against many Central and South American countries, the gap in training conditions at U11 and U13 is real. That is my inference from the general structure of Pan-American table tennis, not from the source data, so I hold it at low confidence.
Those three components together explain most of the 76.8 percent. I am not saying it is meaningless. I am saying it measures something far narrower than it appears to.
A regional ceiling and a global ceiling
This is where I want to pause longest, because it is the type of error I meet most often in daily work.
In football, I have seen Southeast Asian clubs pay high fees for Brazilian strikers over 28, purely on the basis of goal totals in a domestic league. I built a transfer database of more than 200 deals from 2026 to 2026 during the pandemic shutdown, and what I found was not a common denominator of quality but a common denominator of misread data. People take an indicator from a narrow market, apply it to a wide market, and ignore the gap between the two.
The 76.8 percent rate in Katy is an indicator from a narrow market: youth table tennis in the Americas, where the host is the best-resourced nation. It is not an indicator for global youth table tennis. At U11 and U13 level, the distance between a good training base and an excellent one is often masked by physical maturation speed. A 12-year-old who matures early can beat a 12-year-old with better technique, and that result predicts nothing for age 18.
The history of Pan-American table tennis shows a clear pattern: regional junior dominance does not automatically convert into depth at world professional level. Brazil is the standout exception, and Brazil built that position through a generation of senior players competing internationally, not through U11 medal tables. For the rest of the continent, medals at the youngest bands rarely come with a top-10 world presence in adulthood.
I do not believe in fate; I believe in correlation coefficients. And here, the correlation between U11 and U13 results and elite results is weak. It is weak because too many variables intervene: physical growth, technical change, competition from school sports, and the child's own decision to walk away.
What a coach says and what a coach does not say
Coach Tim Wang attributed success to commitment and determination. I do not dispute that. But I note one thing about the structure of the statement: when a development-level coach is asked about a near-sweep, he usually talks about mentality, because mentality is hard to contradict with data. Talking technique would require specifics: how this child handles short balls, how the racket is gripped, how the footwork works at close range, whether the backhand is stable. Talking mentality is far safer.
Fans remember player names; I remember contract expiry dates. With a document that names no one, the only thing I can measure is structure. And structure gives me exactly one conclusion: at U13 level in the Americas, at this moment, the United States has more players at the same level than the rest of the region. That conclusion is narrow, and I keep it narrow.
A comparison from the Vietnamese context
I grew up following Vietnamese table tennis through provincial team systems, national youth championships and a relatively narrow selection base. The number of players aged 11 to 13 in Vietnam is far smaller than in a country with an active private academy system.
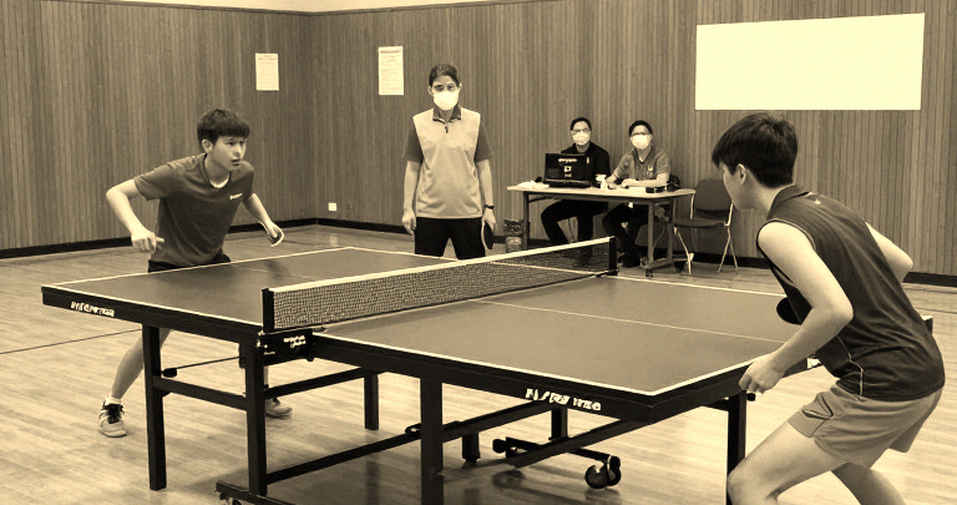
That means when I read a medal table like Katy's, I do not compare it to Vietnamese table tennis, because the two settings do not share a unit of measurement. I take only one usable lesson: at young age bands, the number of players operating at the same level matters more than one outstanding individual. A youth system only endures when it has enough people to fill gaps when some leave for school or injury.
Seven U13 golds are a signal in that direction, at the scale of the Americas. They say nothing yet about whether the U.S. youth system can hold at U19 level.
Industry value: small, short, but real
Along the industry transmission chain, this event's impact sits entirely upstream and midstream. Placing the U11 and U13 Americas Championships on American soil stimulates demand at academies and clubs in the Houston metro area: parents enrol their children, academies gain a story to tell, and some facilities are upgraded to host the event. The effect is small and short-term, but real.
Downstream, the impact is close to zero. No star was named, no sponsorship was announced, no prize money existed, and the broadcast value of a continental U11 and U13 event is very low. In my tracking sheet, this is a data point in the grassroots-building column, not the commercial-value column.
What deserves more attention is repeatability. If ITTF Americas continues to place its U11 and U13 championships in U.S. cities over several years, the strategic consequence is not the host delegation's medal count but the emergence of a cyclical domestic youth circuit. That is what could genuinely change the structure of American youth table tennis.
Risk sits downstream, not upstream
If I had to rank one single risk for the U.S. youth programme after this event, I would not place it in recruitment or coaching. I would place it in retention.
The U13 band sits below the rising-age threshold I use in my work, under 22. At this tier, every metric is a development indicator, not a competitive-value indicator. A youth pipeline does not die at 12. It dies at 15 and 16, when academic pressure rises, when other school sports pull athletes away, and when the cost of specialised training starts to exceed what most families can carry. In the United States, the school sports system is a direct and very strong competitor.
The U.S. U13 group swept seven events in Katy. What I want to know over the next three years is not whether they sweep again. What I want to know is how many of those players are still competing at national U19 level, and how many appear at a world junior event. The conversion rate from U13 to U19, with named data, would be a far better diagnostic than 76.8 percent.
That is also why I stress the value of naming athletes. No names means no conversion rate. No conversion rate means a medal table is just a snapshot, and snapshots forecast nothing.
The counter-intuitive angle: the prettier the result, the thinner the data
There is a paradox in how we consume medal tables. A moderate result, say 20 of 56 medals, would force us to ask about distribution: which delegation is strong in which event, which age band is weak, who beat whom in the inner rounds. A near-sweep almost eliminates that need. When one delegation takes all 14 golds, there is no head-to-head table to analyse, no contested match-up to compare, and no reason to search for causes at the detail level.
The 76.8 percent rate in Katy is therefore both a strong result and a weak data point. Strong at result level. Weak at information level. And in my work, a weak data point presented as a strong conclusion is the most expensive kind of error. I saw it at the 2026 World Cup, when a long analysis I wrote on Croatia was dismissed by many as luck, purely because it leaned on low possession and fast transition efficiency. I had to rewatch all seven matches and recount Luka Modric's running distance and sprint counts to show that my conclusion rested on data, not feeling. The lesson was not to trust data. The lesson was that data must be proportionate to the size of the conclusion you want to draw.
In Katy, the only proportionate conclusion is regional. Any conclusion beyond regional level is borrowing the authority of a data table to say something the table does not say.
Croatia 2026 was the sum of passes people ignored. Katy, if it carries a similar lesson, is that every junior medal here is the sum of training sessions nobody counted, and no table records them. The medal table is only the visible surface.
Signals for the next cycle
I do not conclude anything about the global strength of American youth table tennis, because I do not have the data to do so. I only record the signals worth tracking, and the conditions under which they become evidence.
The U.S. U13 group swept seven events in Katy. If within one to three years a few players from that group appear at continental or world junior events with comparable results at U15 and U19 level, the 76.8 percent rate in Katy is upgraded from a regional result to a pipeline signal. If they do not appear, that rate is downgraded to home advantage on a thin field.
The second signal is the opponent side. The report does not tell me which federations took the remaining 13 medals. If in later editions countries such as Brazil, Canada or Puerto Rico close the gold gap, this sweep will read as the product of a weak field rather than a superior training system.
The third signal is repeatability of the host city. A single edition creates no trend. Three consecutive editions on American soil, with three large host delegations, begin to create a structure worth analysing.
The fourth signal, and perhaps the one I care about most, is data publication. If ITTF Americas starts releasing results documents with athlete names and game-by-game scores, the analytical value of the event rises sharply. A U13 event with complete data can teach more than a U13 event with only a medal table.
The Da Nang database taught me that the hardest part of any data system is not collection, but the patience to wait until there is enough data to say something true. In Katy, I am in exactly that state: a clear result, almost all detail missing, and a conclusion that has to be held as narrow as possible.
For a youth table tennis system, the distance between a continental medal at 12 and a national team place at 20 is wider than any standings table can display. The job of a data analyst is not to fill that distance with speculation. The job is to record the timestamps, the names and the dates, and to come back and read them in three years.